Digitising site deliveries saves BW time, avoiding £50k of compliance costs
1 April 2026

AtkinsRéalis reveals how it is using real-time carbon modelling and the geolocation of the BIM elements to OS coordinates on the Bridgwater Tidal Barrier for the Environment Agency.
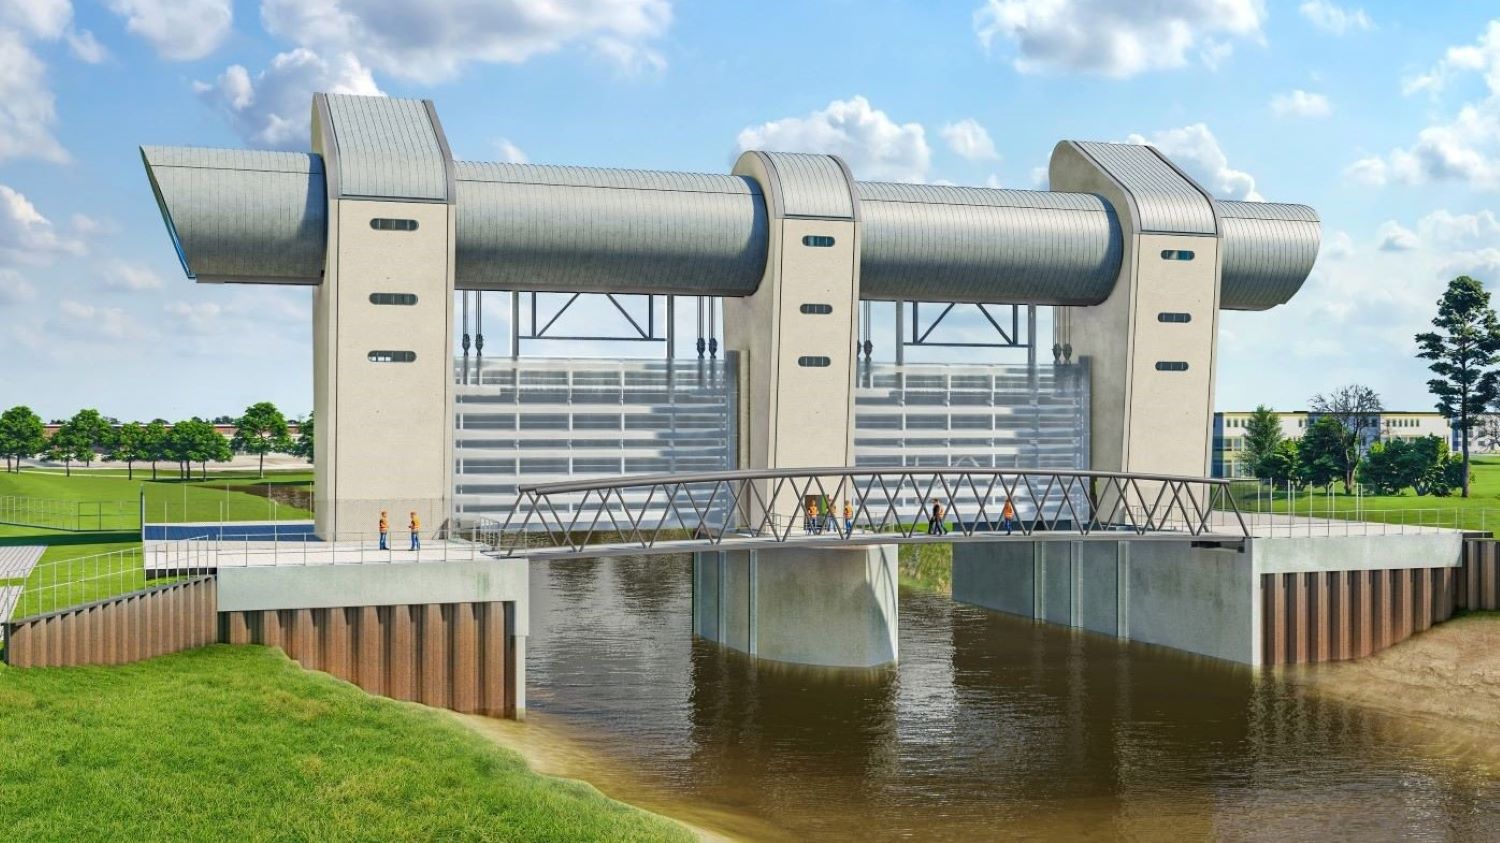
Hinkley Point C is not the only megaproject underway in Bridgwater, Somerset. A few miles down the road, another great feat of civil engineering is taking shape. This is the £249m Bridgwater Tidal Barrier, which is being built to protect the town and surrounding communities from tidal flooding from the River Parrett. It is one of the Environment Agency’s largest and most ambitious flood defence projects. The arrival in March of a river-borne 30m-long jack-up barge, from Liverpool, with a 300-tonne crane perched on it, marked a major milestone and gave locals a sense of the scheme’s scale.
A great deal of construction activity is now underway. The gigantic crane has been put to use helping construct the cofferdam and bearing piles for the barrier’s foundations, together with great swaths of civil and environmental works on the surrounding banks. What onlookers won’t see, however, is the advanced digital engineering that has taken place behind the scenes.
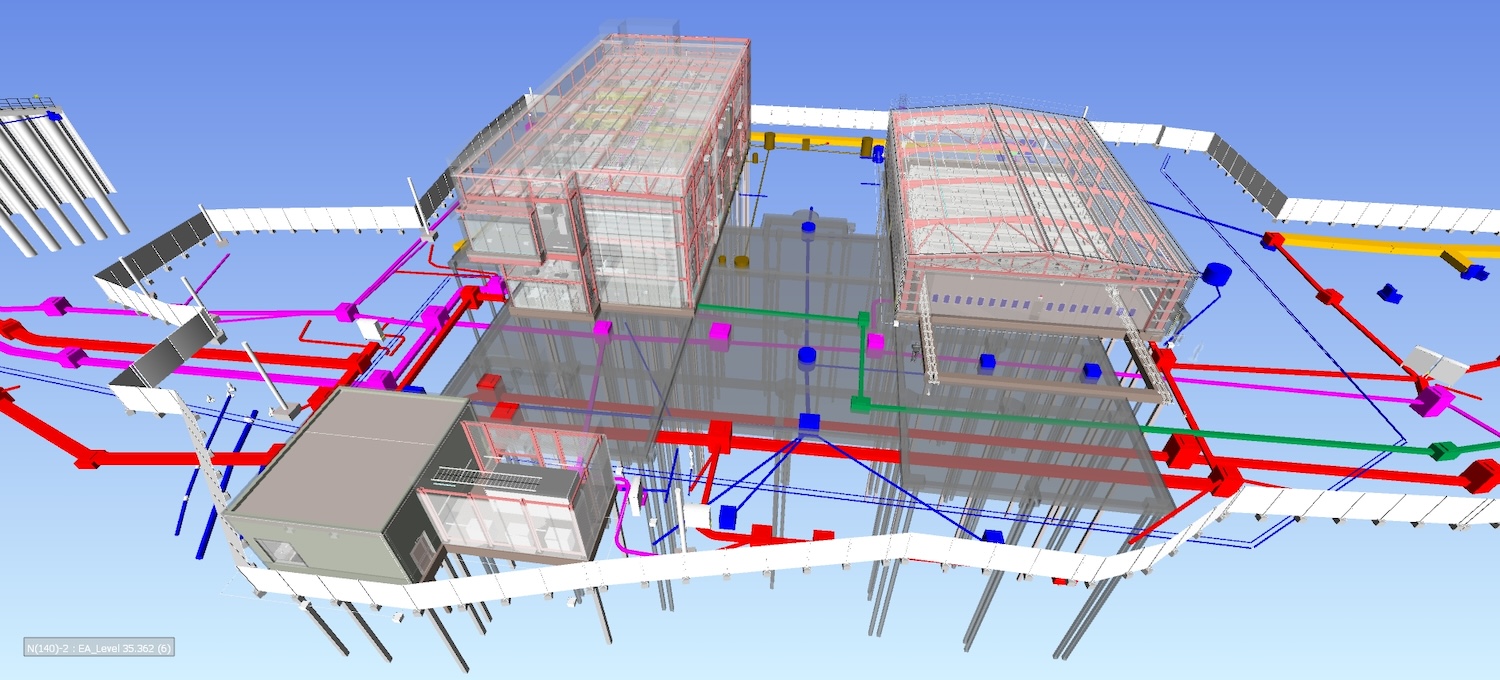
Consulting engineer AtkinsRéalis has developed one of the Environment Agency’s most detailed BIM models. From an outline design developed by Jacobs, AtkinsRéalis, appointed to undertake the detailed design in 2021-2022, developed a fully federated BIM model of the scheme.
The model is now being used effectively in tandem with Kier to simulate construction stages and to reduce embodied and lifecycle carbon – with reported reductions of 54% and 47% respectively. It will be one of the Environment Agency’s most detailed twins in its large network of geolocated digital assets.
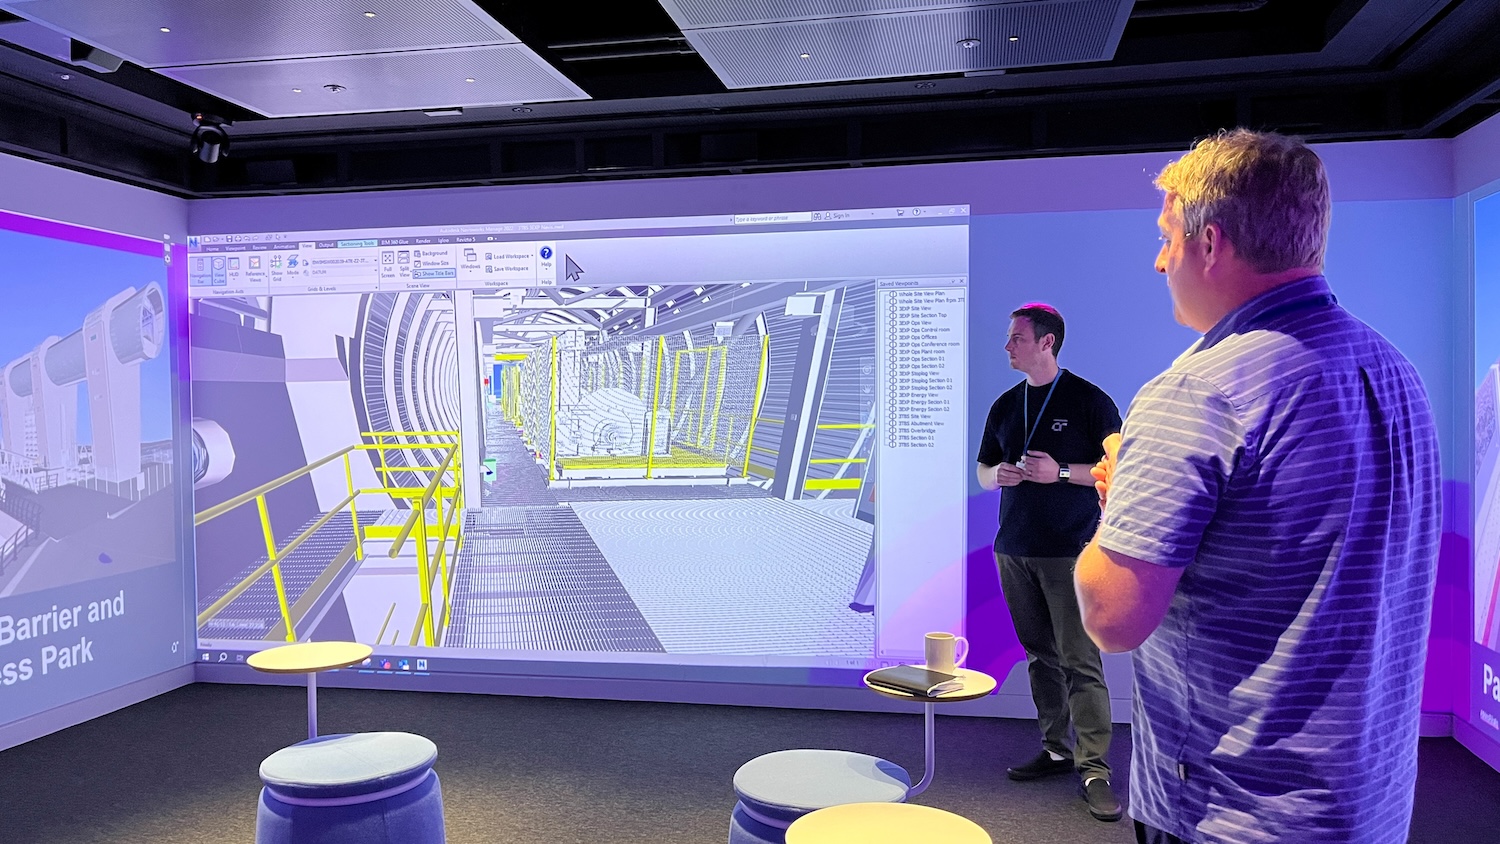
How appropriate, then, for AtkinsRéalis and its key partners on the scheme, the Environment Agency and Kier, to be highlighting the new project at the consulting engineer’s Lava Lab – an immersive space equipped with full-size screens on four walls at its central London offices.
“There are more than 35 disciplines from AtkinsRéalis working on this model alone,” says Jack Mees, site-based design coordinator at AtkinsRéalis. “They include geotechnical, electrical, mechanical, civils and structures, and we’ve even got an interior design model in there for the operations building. That indicates the level of detail we’re modelling it to – every wire, every plug, every nut, every bolt and all the underground services as well.”
The model has been used extensively for clash detection and turned into a 4D model by Kier to optimise construction sequencing and minimise health and safety risks. The 4D animation of the scheme’s construction provides a way of onboarding those on site and engaging with wider stakeholders, Mees says.
But two key strands stand out in the way this project has been modelled in BIM: the real-time use of carbon modelling, and the geolocation of the BIM elements to OS coordinates.
Accurate, consistent asset data is more than an administrative necessity for the Environment Agency, it’s a regulatory requirement. As Mees explains: “The Environment Agency has very specific requirements from us as their consultants to supply their data in a certain way so they can use it in the future.”
That “certain way” is tightly linked to the Agency’s Asset Information Management System – a web-based tool known as AIMS. “All of their assets are geo-referenced on a system,” Mees explains. “When you click into these, it gives you the asset’s location, its size, what materials are present and their lifespan – basically lots and lots of information.”
Traditionally, the Environment Agency’s data was structured around its data requirements library (DRL) and was captured, but not necessarily tied to, its physical location. Now, new assets and even many existing ones are being migrated to a fully geo-located system. Assets need to be coded in a certain way, Mees explains, to meet environmental, operational and safety requirements.
On large, complex schemes, the change is transformative. At the tidal barrier in Bridgwater, for example, the 3D model contains 85 assets, and within those assets are some 30,000-plus individual attributes. Each sheet pile, embankment crest and culvert has its own coded data card. Traditionally, that information would be extracted manually from 2D or 3D models into spreadsheets: a process that, when sent to the Environment Agency, could take up to 18 months for staff to input into AIMS for a typical project.
Working with the Environment Agency’s digital and data information (DADI) team, Mees and his colleagues sought to break this bottleneck. “We basically built all the asset data into our 3D model as metadata and then broke their existing systems to try to see how we could make it work,” he says with a grin. The result? Data can now be exported directly from the model, straight into a machine-readable spreadsheet that can be used to populate AIMS at the click of a button – bypassing the lengthy process to manually enter the data into the system
The Bridgwater scheme was chosen as the ultimate stress test. “If you can do it on Bridgwater, you can do it with any small project,” Mees says. Its success has eliminated excuses for not adopting the approach elsewhere, he adds.
AtkinsRéalis’s work has also advanced the integration of carbon data into asset models. Historically, the Environment Agency’s DRL and its carbon calculator tool – known as ERIC – used incompatible asset codes. “That’s the innovative bit,” explains Matt Walker, design manager at AtkinsRéalis. “We had to do a bit of mapping so that you could take the information from the model and put it into their carbon calculator.”
With carbon now embedded as an attribute, the tool can calculate environmental impact directly from the geo-coded model data (see below).
The technology stack is familiar to anyone in the BIM world: Revit for structural modelling; Navisworks to federate models and run clash detections; Civil 3D and LSS software for earthworks; Inventor for mechanical elements; Tekla for reinforcement. What’s different is the way all these feeds are harmonised to deliver rich, coded asset cards, each tied to precise geospatial coordinates.
For Mees, who has spent 20 years delivering schemes for the Environment Agency, the project stands out as one of the best he’s worked on. “It’s nice to do something that’s really innovative,” he reflects. And he’s convinced the approach has wider potential: “Water companies, railways and highways, there’s a lot of replication there that screams out for this type of thing.”
While there’s still “a bit of a disconnect” between the Environment Agency’s BIM aspirations and consistent delivery across all projects as suppliers get to grips with the requirements, the direction is clear. As Mees’ experience shows, when geo-referenced asset data, structured coding and BIM modelling are tightly integrated, the pay-off is measured not just in efficiency gains, but in readiness for the future.
Carbon reduction was placed on an equal footing with parameters such as cost, time and quality on the project, says Walker, which he had never experienced before. “The client had very strict demands around net zero and carbon reduction over the lifecycle of the scheme, with a target of 45% whole-life carbon savings written into our scope for detailed design.”
Traditionally, he says, “the carbon calculator is used at the end of detailed design… [meaning] you don’t really understand the impact of the decisions you’re making on carbon through development of the design”. This project instead secured Environment Agency net-zero innovation funding to trial BIM-enabled carbon analytics, part of AtkinsRéalis’s digital transformation programme.
The funding allowed AtkinsRéalis to integrate the Agency’s ERIC carbon calculator into its BIM Analytics – Carbon platform, enabling live carbon analysis directly from the BIM model. ERIC was developed in-house to standardise how carbon is assessed, reported and managed across its flood and coastal risk management projects.
Walker says: “One of the main challenges was that we had built asset data in our system, but it was not aligned to the way assets were covered in the Environment Agency’s carbon tools, which we were expected to use. So we had to do a bit of mapping to enable direct comparison.”
AtkinsRéalis’ digital tool generates a carbon dashboard and heatmap, pinpointing high-impact design elements – in Bridgwater’s case, particularly in the foundations. Walker explains this meant designers could refine their choices iteratively, with immediate feedback on carbon consequences, thereby allowing them to track carbon savings as they happened.
“We built carbon information into our models so that, in real-time, any adjustments we made would be updated on the dashboard, meaning you could review the impact that your decisions were making throughout the design process.”
One major change involved switching from steel-cased reinforced concrete piles to driven steel tubes for the barrier foundations, reducing carbon by more than 25% in that element alone. Walker says: “Initially, there were about 100 large, 1.5m-diameter, steel-cased reinforced concrete piles. By re-engineering, we could remove the concrete and reinforcement entirely, leaving just the steel tube.”
Other optimisations included a precast concrete solution for the project’s towers, which form part of the barrier’s structure, and a revised reinforced concrete apron slab.
Against the baseline design, the barrier element alone achieved a reduction in embodied carbon of 54%, with a forecast whole-life carbon saving of 47% for the scheme.
Collaboration with the contractor was key. Isman Cooper, Kier’s chief engineer for the ECI phase of the barrier, says the company was given early access to design calculations, allowing it to identify where the opportunities might be and provide feedback before decisions were finalised. Trial pilots on site confirmed the feasibility of the changes.
The project demonstrated that embedding carbon into everyday design decision-making – supported by live digital tools and open collaboration – can deliver results well beyond initial targets. “Following this process, we have made some significant savings, showing that innovation and early integration can fundamentally shift carbon outcomes in infrastructure design,” says Walker.
The tool is now being rolled out on other Environment Agency projects.
AtkinsRéalis says this approach not only achieved substantial emissions reductions during early-stage design, but also offers a scalable digital solution for future low-carbon infrastructure projects across the UK.
The nearby Somerset Levels are extremely low-lying, and the area is vulnerable to tidal surges from the Bristol Channel. Without the barrier, future sea-level rises and more extreme storm surges could overtop existing defences, putting thousands of homes, businesses and key infrastructure at risk. The barrier will bring long-term flood protection (to 2070 at least) for around 11,300 homes and 1,500 businesses.
As well as the barrier structure itself, the project includes 4.3km of new flood defence banks and 2.8km of raised existing banks downstream. Importantly, the scheme is also delivering improvements to fish and eel passage at 12 sites upstream of the barrier, which currently present a barrier to fish migration, improving more than 100km of major river.
Construction of the early works began in 2023. The main barrier contract will be awarded later this year. Early works are being undertaken by Kier and include piling for the bypass channel and cofferdam, which have been driven over 20m deep into the river to keep water out while building the permanent foundations. The barrier is expected to be completed and opened in 2028.
The barrier structure itself consists of two vertical lift gates that can be lowered to block incoming tides during extreme events. Each of the two gates is expected to be 15m wide and 10m high. They will be operated remotely but with onsite control facilities.
Jeanne Capey, project director at Environment Agency, says the plan is that the barrier will be closed during extreme high tides, which are expected a few times a year, becoming more frequent as sea levels rise in the wake of climate change.
Keep up to date with DC+: sign up for the midweek newsletter.